Effects of Climate Change on FL Hardwood Forests - Soltis Lab
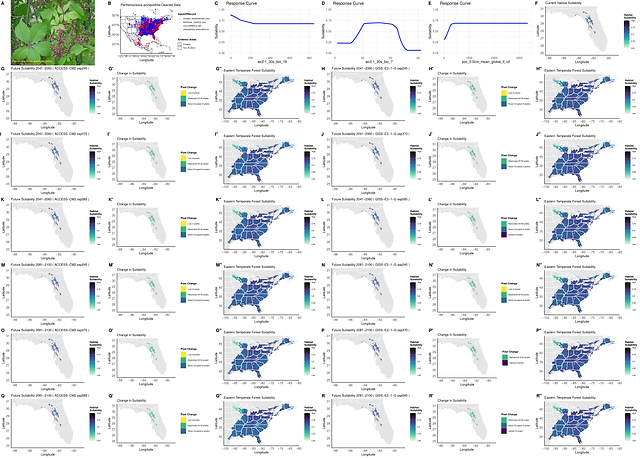
I continued the CURE class project with the Soltis Lab, expanding the project to include 40 Florida Hardwood Forest plant species. My lab partner and I worked in R to clean over 1.2 million occurrence points between all of the species based on accepted synonyms, completed data fields, endemic areas and basis of record. Then various temperature, weather, and soil factors were analyzed based on the current locations of the cleaned data points to determine the most important variables for each species to grow. Then, based on current levels of each variable in Hardwood Forests, the current habitat suitability of each species is calculated and mapped. Then, the future suitability of each species in both Florida Hardwood Forests and Eastern Temperate Forests, as defined by the Environmental Protection Agency, is calculated and mapped based on climate scenarios of varying severity. Additionally, related trends were explored for potential explanations, including changes in minimum and maximum latitude over time, species richness in Hardwood Forests, and current management zones overlapped with Hardwood Forests.
Through this experience, I gained:
-
In-depth experience coding in R to clean data, perform statistical tests, generate publication-quality maps and figures.
-
Scientific writing practice through co-authoring a manuscript currently being prepared to submit to a journal.
-
Multiple instances of presentation experience at the Fall 2024 and Spring 2025 University of Florida Undergraduate Research Symposia and the Spring 2025 Botany Undergraduate Research Symposium.
-
Effective collaboration with lab partners and mentors to manage a complex, multi-species dataset and develop a cohesive research product.

Presenting poster at Fall 2024 Undergraduate Research Symposium.
Examples of Generated Maps and Figures:
All created in R

Figure generated for paper, depicting two example species' current and future habitat suitability, and a comparison of the pixels between each.